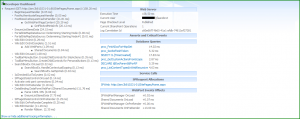
One of the cool things in SharePoint 2010 is the Developer Dashboard. This gives you all sorts of insightful information about the page you are currently on. In addition to the out of the box information it provides, you can also add your own custom information to it. Here’s a quick write up on how to get going using the dashboard.
First of all you’ll need to turn it on. There’s basically three ways of doing this. You can use PowerShell, STSADM, or you can do it through code. Personally, I prefer to wrap it up in a feature and turn it on and off in the FeatureActivated() and FeatureDeactivating() methods. This way I have an easy way to turn it on and off through the GUI.
The code is very simple. Create a new SharePoint 2010 empty project and add a Feature to it. Then create a feature event receiever and use the following code:
using System.Runtime.InteropServices;
using Microsoft.SharePoint;
using Microsoft.SharePoint.Administration;
namespace DevDashboardTest.Features.DashboardTest
{
[Guid("08f6540c-6675-49c0-a39a-52990c4b04d0")]
public class DashboardTestEventReceiver : SPFeatureReceiver
{
public override void FeatureActivated(SPFeatureReceiverProperties properties)
{
SPWebService service = SPWebService.ContentService;
service.DeveloperDashboardSettings.EnableDiagnosticMode();
}
public override void FeatureDeactivating(SPFeatureReceiverProperties properties)
{
SPWebService service = SPWebService.ContentService;
service.DeveloperDashboardSettings.DisableDiagnosticMode();
}
}
}
This will turn on the Developer Dashboard when activating the feature, and turn it back off when the feature is deactivated. Deploy it to your site and activate the feature and you’ll notice a small icon in the upper right corner of your site.

Click on the icon, and the developer dashboard will be turned on and show up at the bottom of your page.

Now let’s take a look at how we can add some information in there that we’re actually interested in. For demonstration purposes I created a Visual Web Part which and put some slow code in there. Here’s an example:
using System.Web.UI;
using System.Web.UI.WebControls;
using System.Web.UI.WebControls.WebParts;
using Microsoft.SharePoint.Utilities;
namespace DevDashboardTest.SlowWebPart
{
public partial class SlowWebPartUserControl : UserControl
{
protected void Page_Load(object sender, EventArgs e)
{
for (int x = 0; x < 10000; x++)
{
int y = x + 44;
}
for (int x = 0; x < 100000000; x++)
{
int y = x + 44;
}
}
}
}
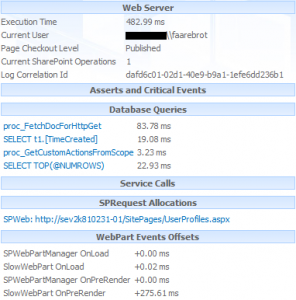
We’ve got two loops here. One is pretty quick, and the other is pretty slow. Stick it on a page and turn on the developed dashboard, and we can instantly see that the web part is adding quite a bit of overhead to the page.

Notice at the top how the entire page now took almost half a second to process. At the bottom we can see that our Web Part ate up the biggest chunk of this at 275.61 ms. Of course this web part only has a couple of loops in it, one of which is significantly bigger than the other. In a real web part these could be function calls to other pieces of code however, and it’s not always easy to see where the majority of time is spent in your code.
This is where SPMonitoredScope comes in. Using this class you can separate sections of your code into scopes and time them. It writes to the Developer Dashboard, but it also writes to the ULS logs which can be handy on it’s own.
Here’s the code from earlier, modified to include SPMonitoredScope:
using System.Web.UI;
using System.Web.UI.WebControls;
using System.Web.UI.WebControls.WebParts;
using Microsoft.SharePoint.Utilities;
namespace DevDashboardTest.SlowWebPart
{
public partial class SlowWebPartUserControl : UserControl
{
protected void Page_Load(object sender, EventArgs e)
{
using (SPMonitoredScope scope = new SPMonitoredScope("SlowWebPart: 10000 times"))
{
for (int x = 0; x < 10000; x++)
{
int y = x + 44;
}
}
using (SPMonitoredScope scope = new SPMonitoredScope("SlowWebPart: 100000000 times"))
{
for (int x = 0; x < 100000000; x++)
{
int y = x + 44;
}
}
}
}
}
I put each of the two for loops into their own scope here, so that we can time them individually. Looking at the dashboard, we can now pinpoint exactly where in our code the majority of the time is spent.

The shorter loop only took 0.04 ms to finish, while the longer one ate up 286.85 ms. A huge difference. Obviously we knew this was going to happen, but in a real situation it’s not always as easy to spot and it can be very valuable.
But what if we have something unexpected happen, or if we just want to see the status of something? Another tip to mention is the SPCriticalTraceCounter class. Using this we can insert messages on our dashboard with a complete call stack. It can be very handy, especially to easily see exceptions that may have been thrown. For a quick demo I changed the Web Part around a bit:
using System.Web.UI;
using System.Web.UI.WebControls;
using System.Web.UI.WebControls.WebParts;
using Microsoft.SharePoint.Utilities;
namespace DevDashboardTest.SlowWebPart
{
public partial class SlowWebPartUserControl : UserControl
{
protected void Page_Load(object sender, EventArgs e)
{
using (SPMonitoredScope scope = new SPMonitoredScope("SlowWebPart: 10000 times"))
{
for (int x = 0; x < 10000; x++)
{
int y = x + 44;
}
SPCriticalTraceCounter.AddDataToScope(42, "Everything succeded!", 15, "Don’t worry, you’re all good…");
}
using (SPMonitoredScope scope = new SPMonitoredScope("SlowWebPart: 100000000 times"))
{
try
{
for (int x = 0; x < 100000000; x++)
{
int y = x + 44;
if (y == 1045)
{
throw new Exception("Something exploded!");
}
}
}
catch (Exception ex)
{
SPCriticalTraceCounter.AddDataToScope(66, "SharePoint Explosion", 1, ex.Message + ": " + ex.StackTrace);
}
}
}
}
}
Notice we’re using the AddDataToScope() method here. There’s not much information or examples in the documentation. The first parameter is basically the ID that the event will show up under in your logs and the second is a string with the name of your category.
The third parameter is the trace level of the event. I can’t find any official documentation on this, but Paul Andrews mentions the trace levels in a blog post from March of last year. Basically it goes like this:
1 Critical
4 Exception (Watson)
6 Assert
8 Warning
10 Unexpected
15 Monitorable
Update: What’s with the integer? Why isn’t this an enumeration? Andy Burns did some investigative work which may interest you. It seems odd that this is a magic value and not an enumeration, but there you go. Maybe next time.
The fourth parameter is your message. Which can be a simple “everything went fine” or the Message and StackTrace properties of an exception.
Let’s take a look at how this all ends up.

Both of the events showed up in the dashboard. One is a monitorable, while the other is a Critical. Click on the blue ID of these, and you get more information about it. Here’s the information from the Critical event:


Leave a Reply